Introduction
Walkability is something I have recently become interested in after learning about the positive impacts it can have on people and communities. I wanted to examine the walkability in the United States to learn more about it and see where there is room for improvement. I completed this as a personal project.
The main questions I had were:
• What percentage of the US is considered walkable?
• What percentage of the US population lives in walkable areas?
• Is there a correlation between walkability and depression, obesity, or pedestrian accidents?
• What areas are the most and least walkable?
• How much does walkability differ among different areas within the county?
This project involved:
• Using Excel for data cleaning, manipulation, and calculations
• Using SQL to join data and make calculations
• Using Tableau to create data visualizations
• Using R for statistical analysis
Analyzing Walkability Data
I started by finding and analyzing a walkability dataset on data.gov that contains walkability scores for each Census 2019 block group in the US, along with many additional columns of data.
Assessing the data
I took time to understand the variables and what types of values they held so that I could come up with a plan to clean and analyze it.
The data included state and county codes, and names and codes for the greater area each block is part of (such as Washington-Arlington-Alexandria, DC-VA-MD-WV), but no specific city names. Because these are large areas and are not a common way to section locations, I chose to explore the data by county to easily map it and compare it to other data.
Each block area was given a walkability score from 1-20, where 20 is perfectly walkable.
A limitation of sectioning by county rather than city is that counties cover a larger area and can include a mix of city, suburbs, and rural areas, and county names are less recognizable than city names. However, analyzing on a county level can still uncover useful insights. Counties are still small enough to point out differences in walkability across the country. For the purpose of this project, I did not need the data to be extremely granular.
Cleaning the data
I used Excel to clean the data by removing columns I did not need, and checking to see if any cells in important columns were blank.
Analyzing the data
Summary data
I first wanted to get an understanding of the walkability scores. I found that the average walkability score for the entire US is 9.61 out of 20. This shows that the US as a whole is not very walkable, but is also not highly unwalkable.
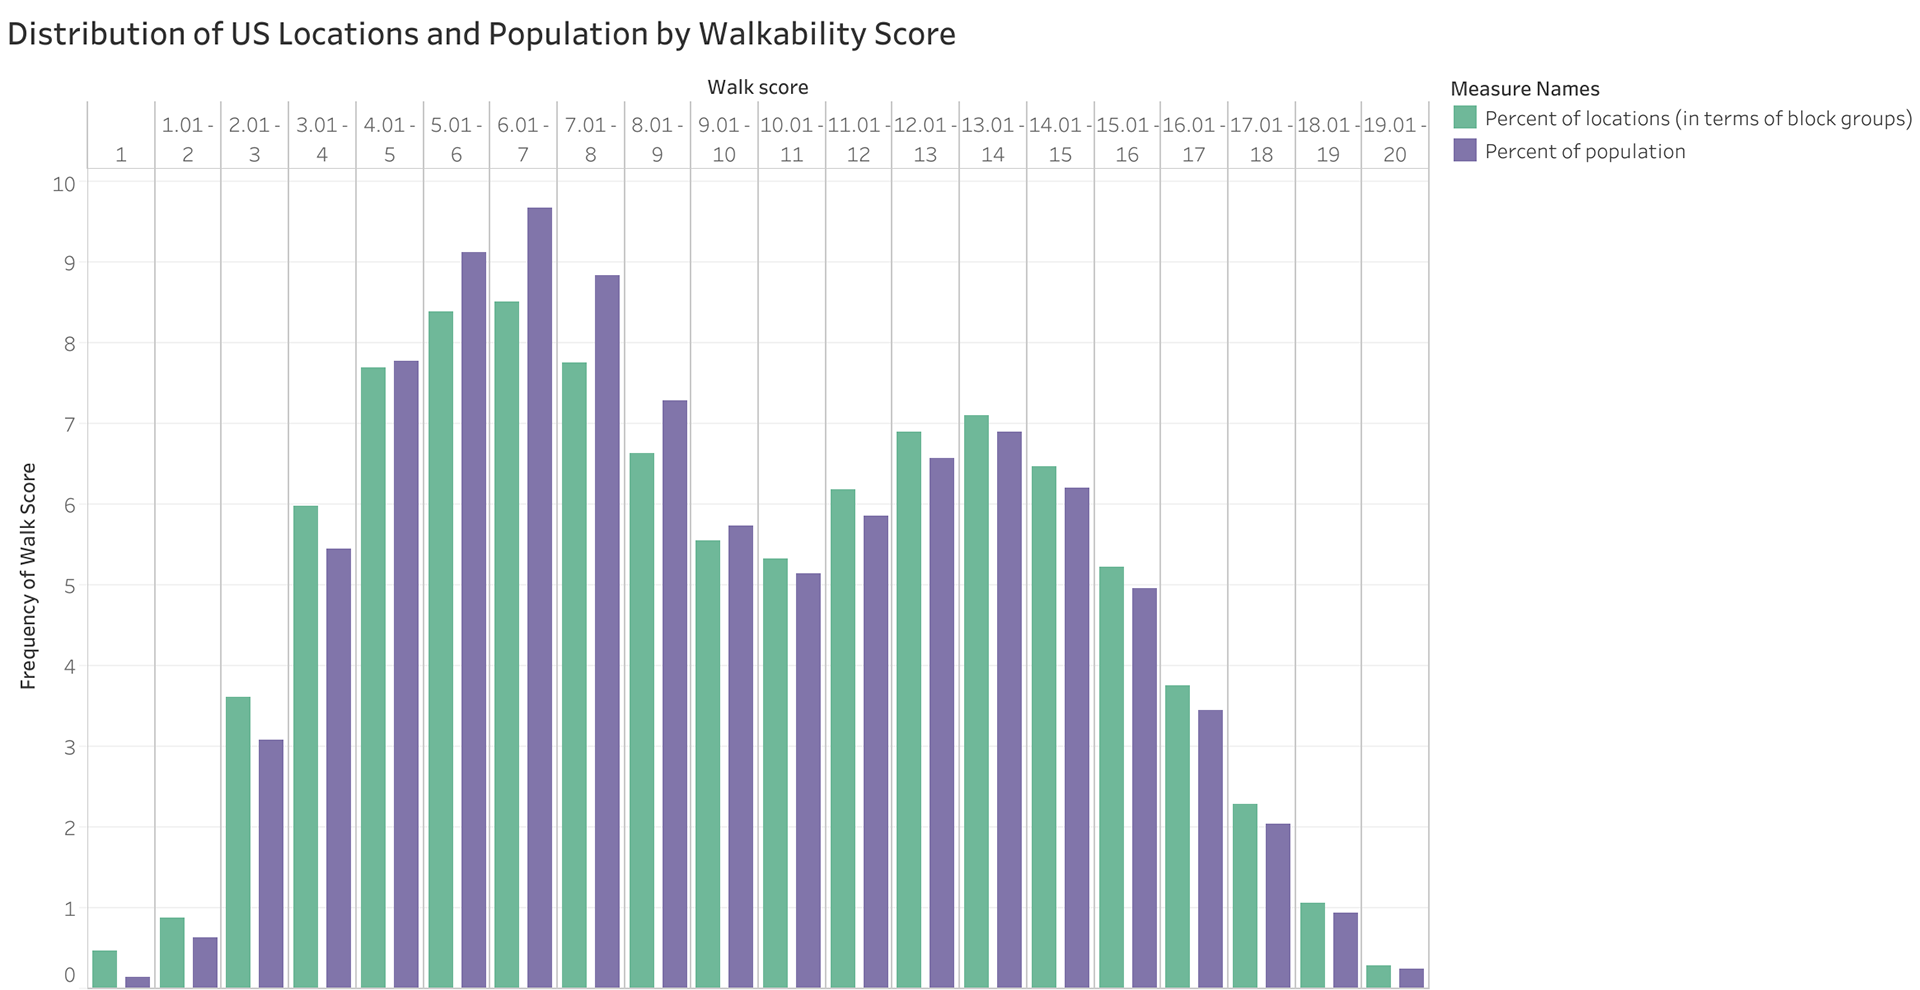
I wanted to see how these scores were distributed, so I calculated the number of instances of each walkability score in intervals of 1 using the COUNTIFS function in Excel. I did this for the locations themselves, and for the population of people living in each location.
Both follow a similar pattern and generally follow a normal distribution but with a dip in the center, and there is a slightly larger amount of data points in the lower half of the walkability scale.
54.8% of locations have a walkability score of 10 or lower, and 57.8% of the population lives in a place with a walkability score of 10 or lower.
16.45% of people live in a location with a walkability score of 1-5, while only 11.79% live in a location with a score of 15-20.
County data
To see where in the US these values are coming from, I used the AVERAGEIFS function to find the average walkability for each county. At this point I only had county and state codes, not names, so I found a list of codes and names for each state and county. Since many states have counties with the same name or code as counties in other states, I combined state and county codes so each county has its own unique code. I used this Excel function to do this:
=CONCAT(RIGHT(CONCAT(0, D2), 2), (RIGHT(CONCAT(0, 0, E2), 3))).
I created CSV files from the state and county lists and used SQL to join them with my county walkability data.

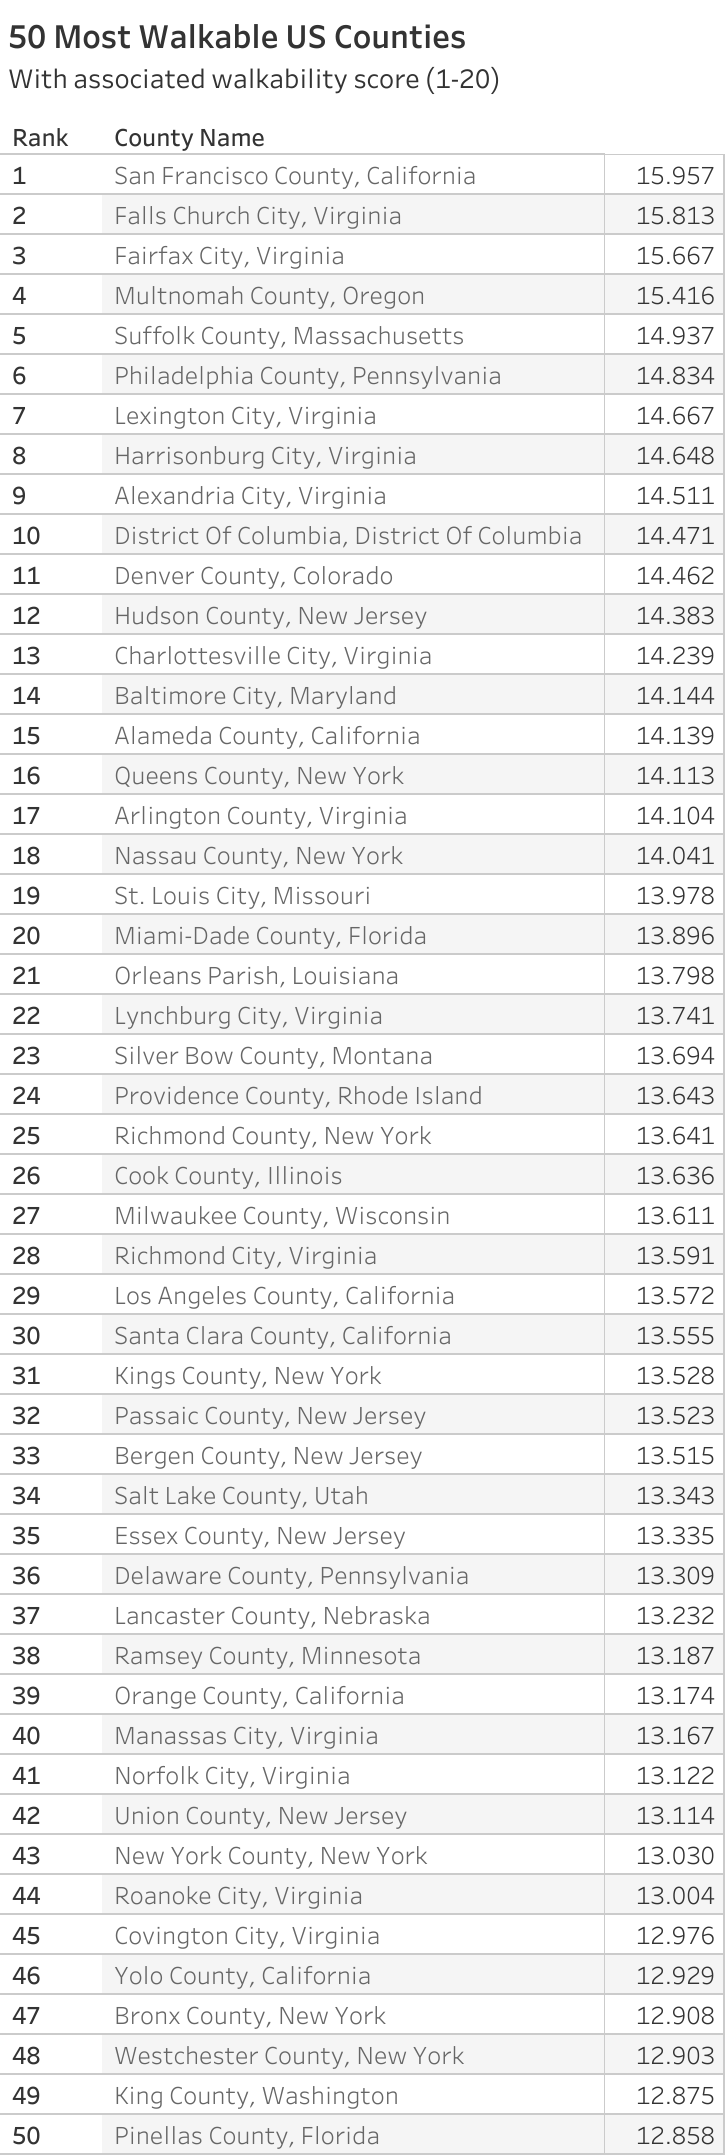
From this new table of walkability by county I found the most and least walkable counties in the US, and created tables using Tableau.

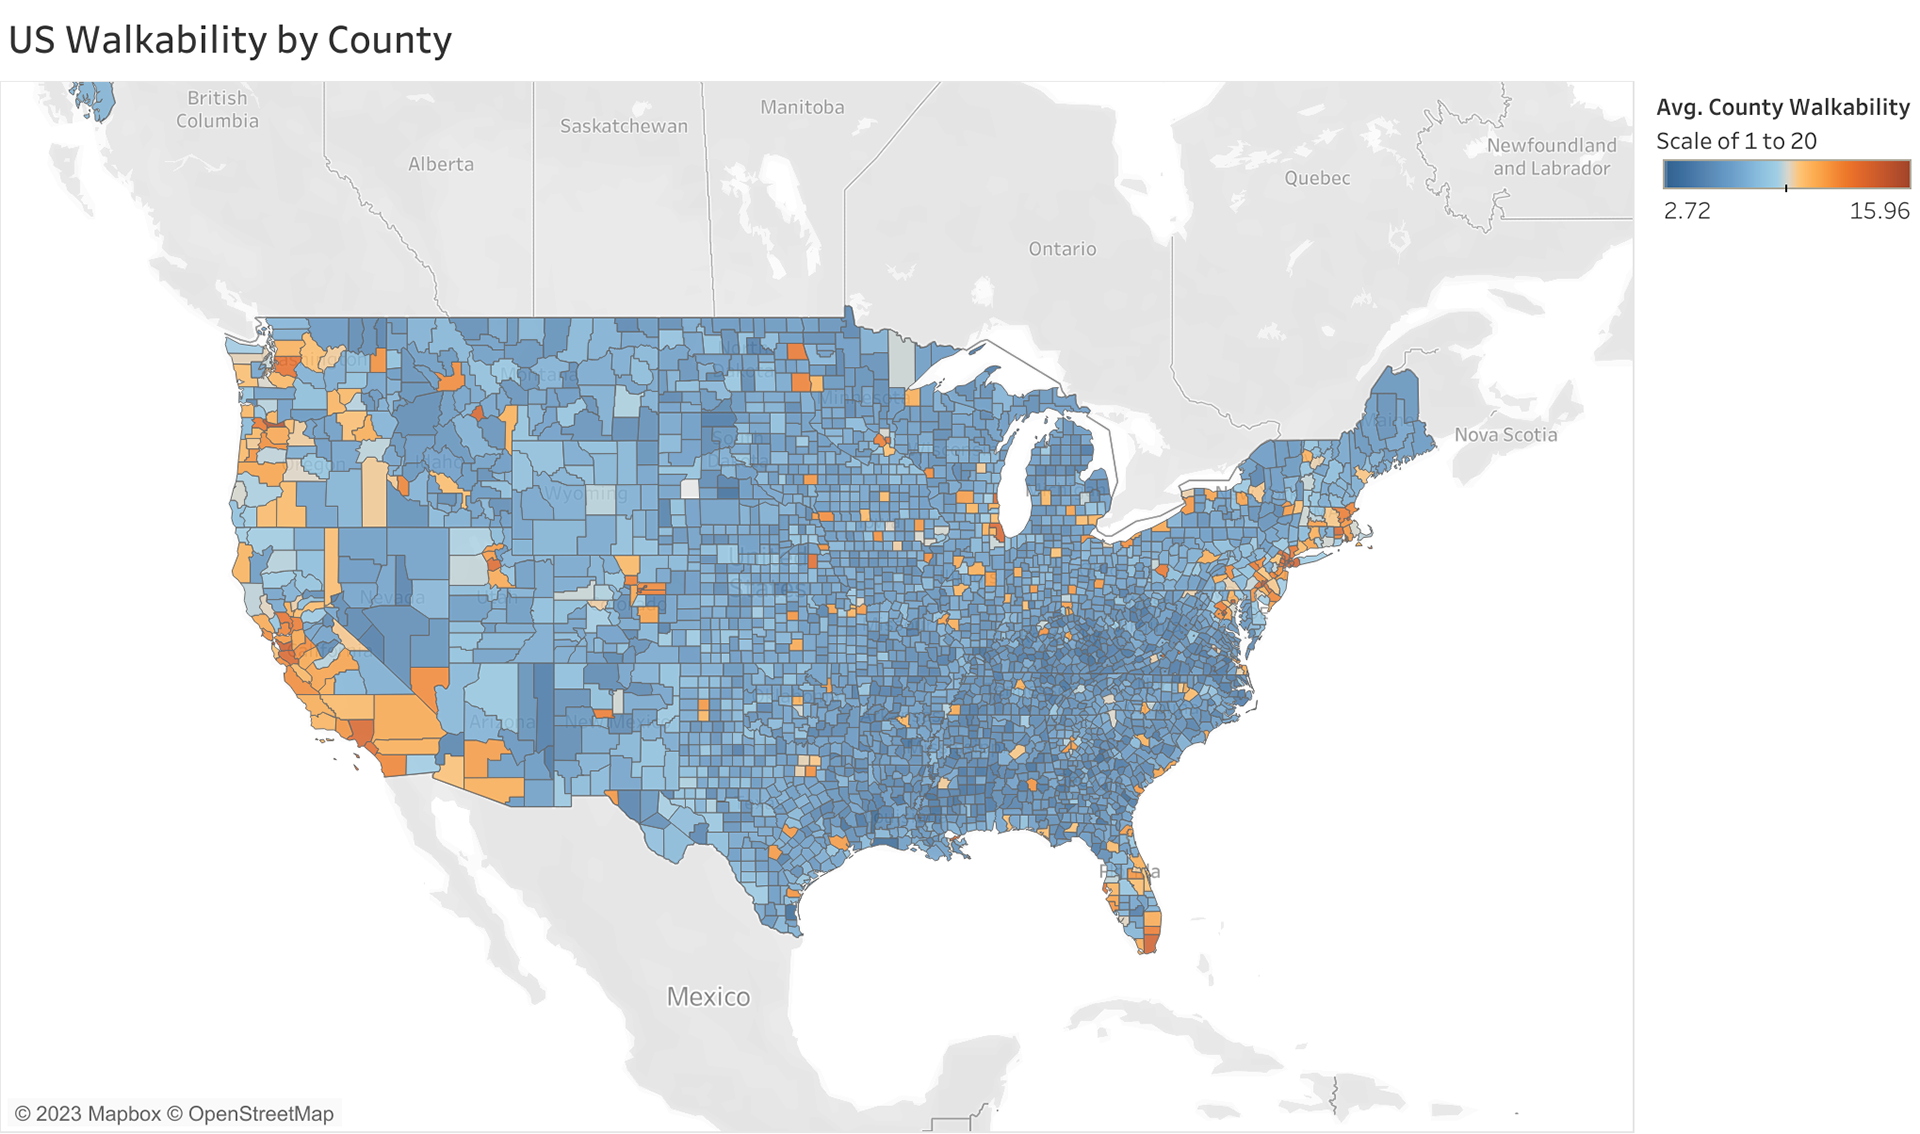
I created this map using Tableau to visualize walkability across US counties. While the midwest has some areas on the higher end of the scale, the coasts tend to have higher walkability compared to the middle of the country. As shown in the distribution graph above, a majority of the country is on the lower half of the walkability scale.
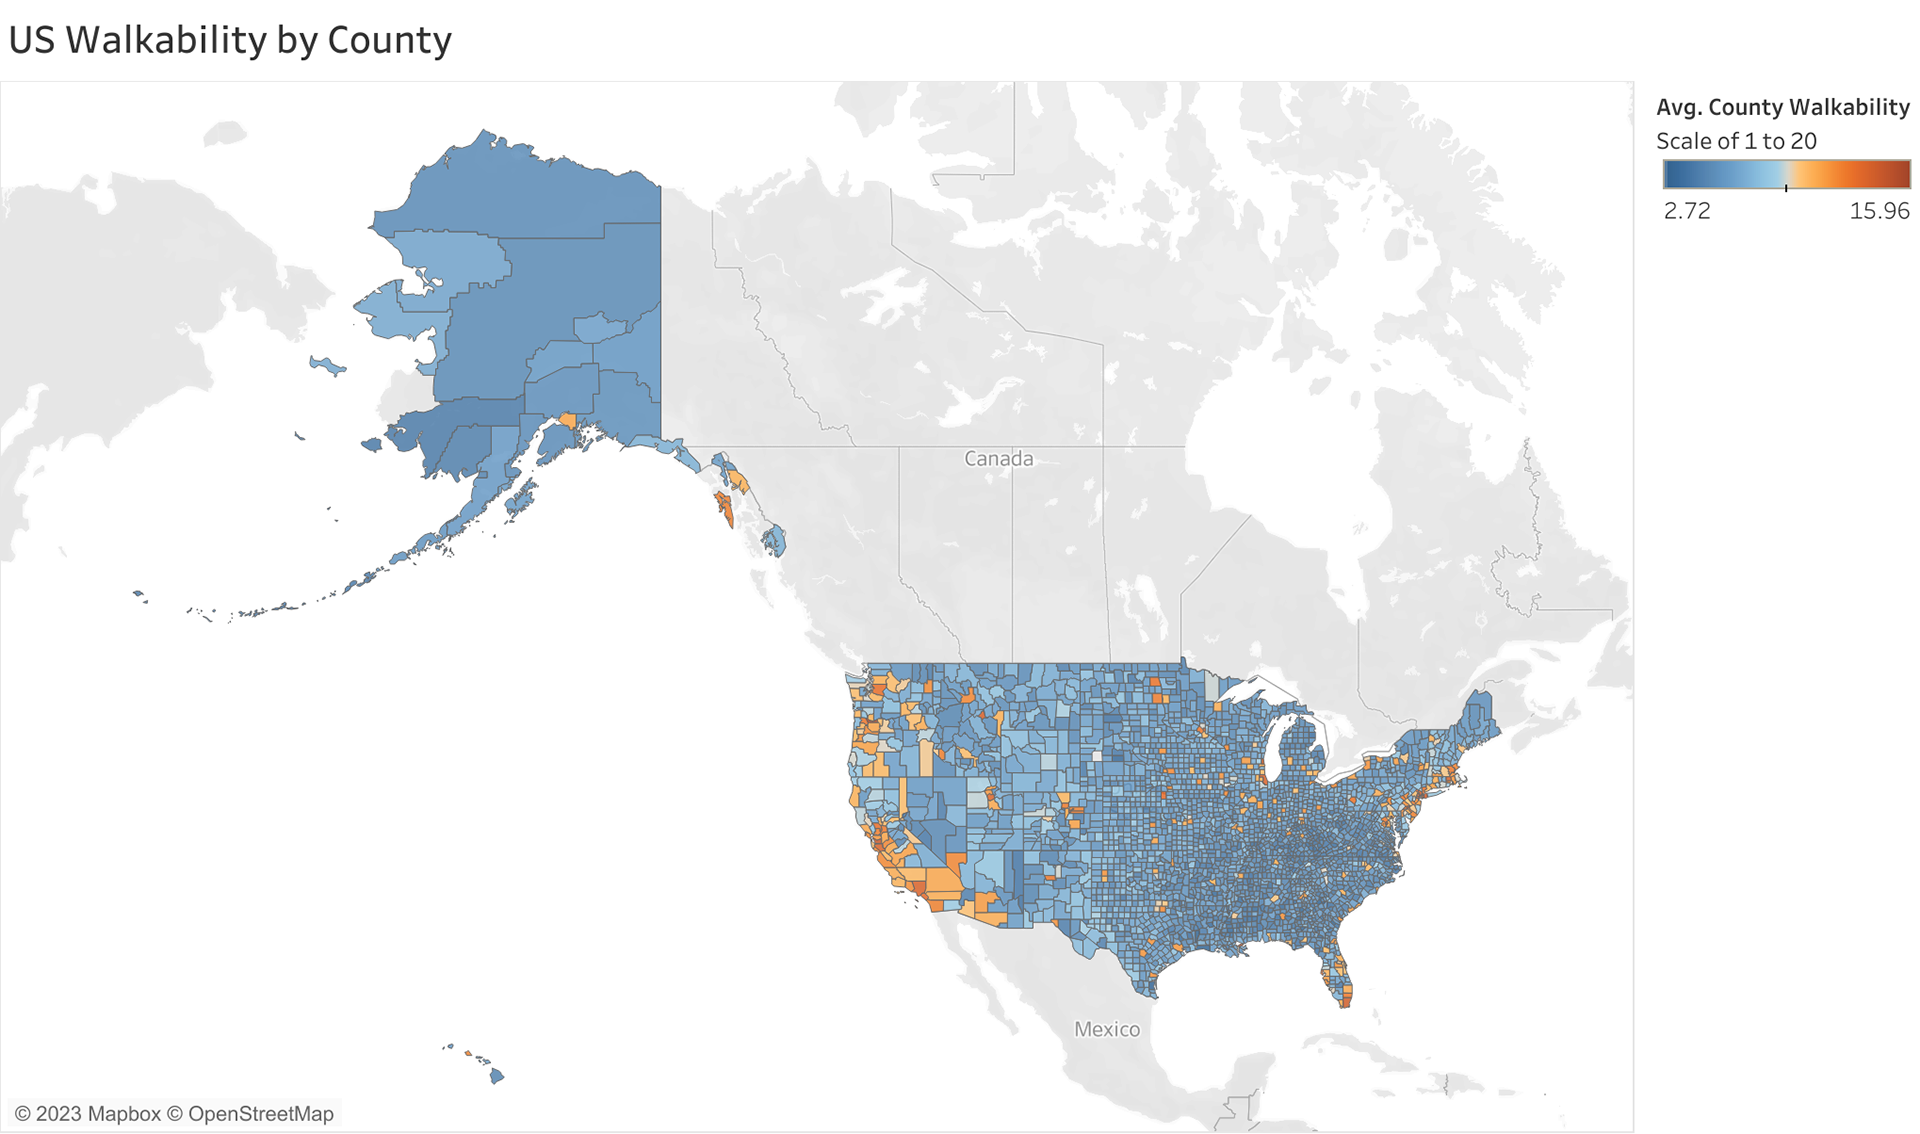
Here is a zoomed out view including Alaska and Hawaii. I was not able to get county names for the entirety of Alaska.
I chose to visualize the 50 most and least walkable counties by creating bar charts showing which states have counties on these lists, and how many counties from each of these states are within the 50 most or least walkable.
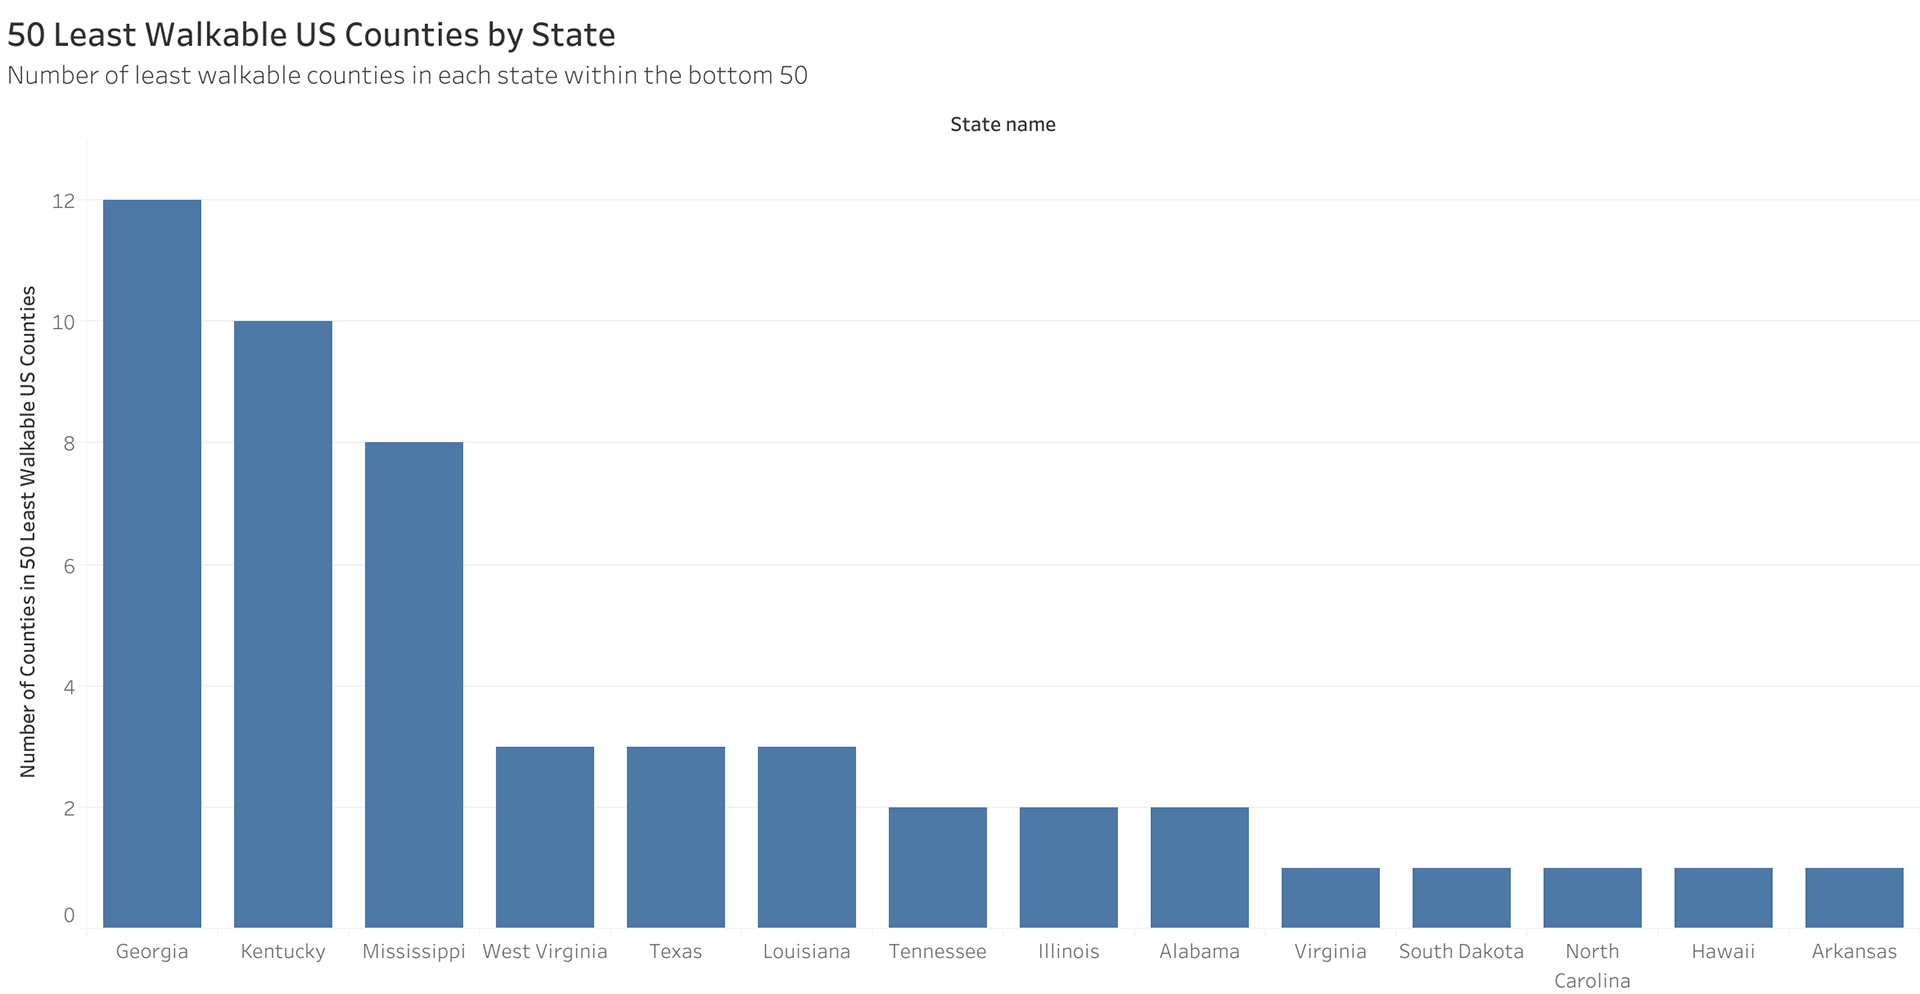
The 50 least walkable counties fall within 14 states, 3 of which have 8 to 12 counties each that appear on the least walkable list. Georgia, Kentucky, and Mississippi account for 60% of the 50 least walkable counties, with 24% being from Georgia alone.
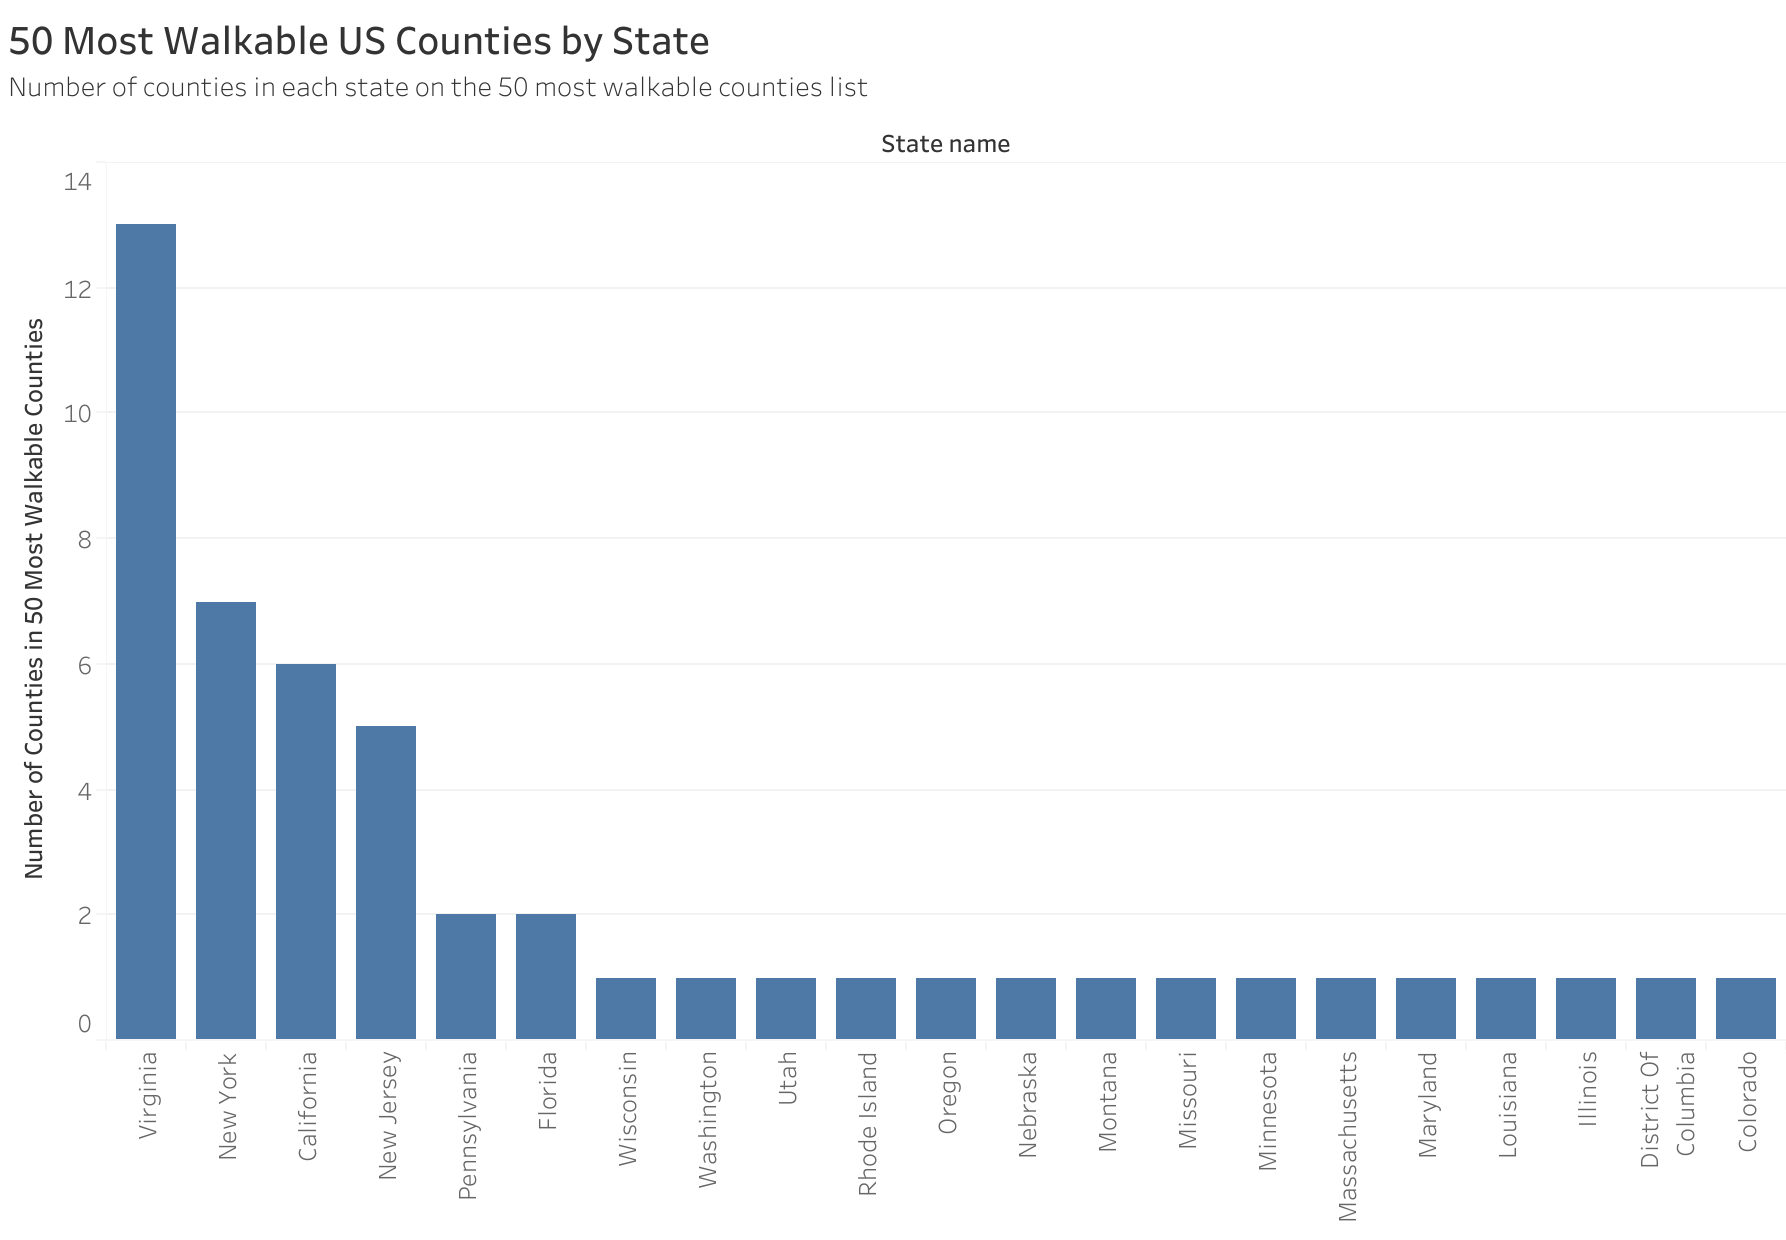
The 50 most walkable counties are spread out across a few more states than the least walkable, with 21 states (including DC) holding the 50 most walkable counties. The state with the highest number of most walkable counties is Virginia, with 13 counties making it in the top 50. New Jersey, California, and New York each have 5, 6, and 7 counties on the list. These top 4 states account for 62% of the 21 states listed, with Virginia taking up 26% of the top 50 counties.
State data
I used SQL to do some calculations to understand what the data looks like on a state level, and compare counties across all states. I used the following code to create a table with 6 different statistics for each state:
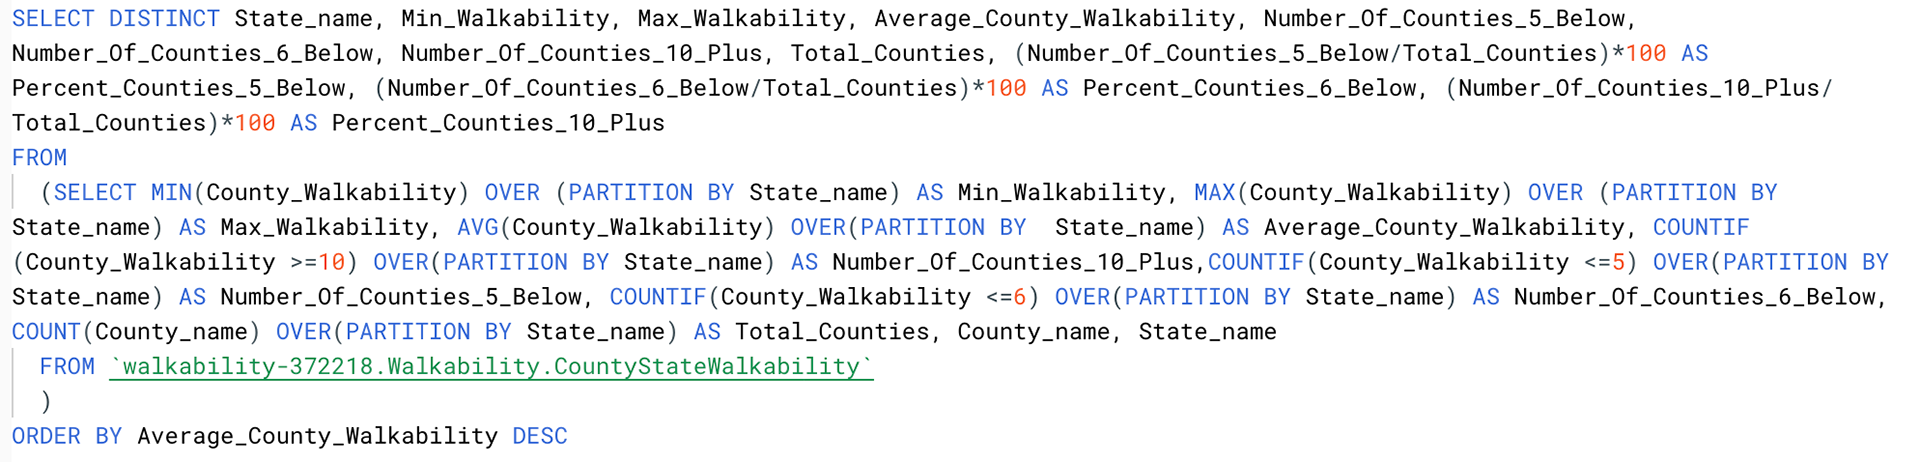
From this table, I had information on:
• The highest, lowest, and average county walkability score for each state
• Percent of counties in each state with a walkability score of 10 or higher
• Percent of counties in each state with a walkability score of 6 or lower, and 5 or lower
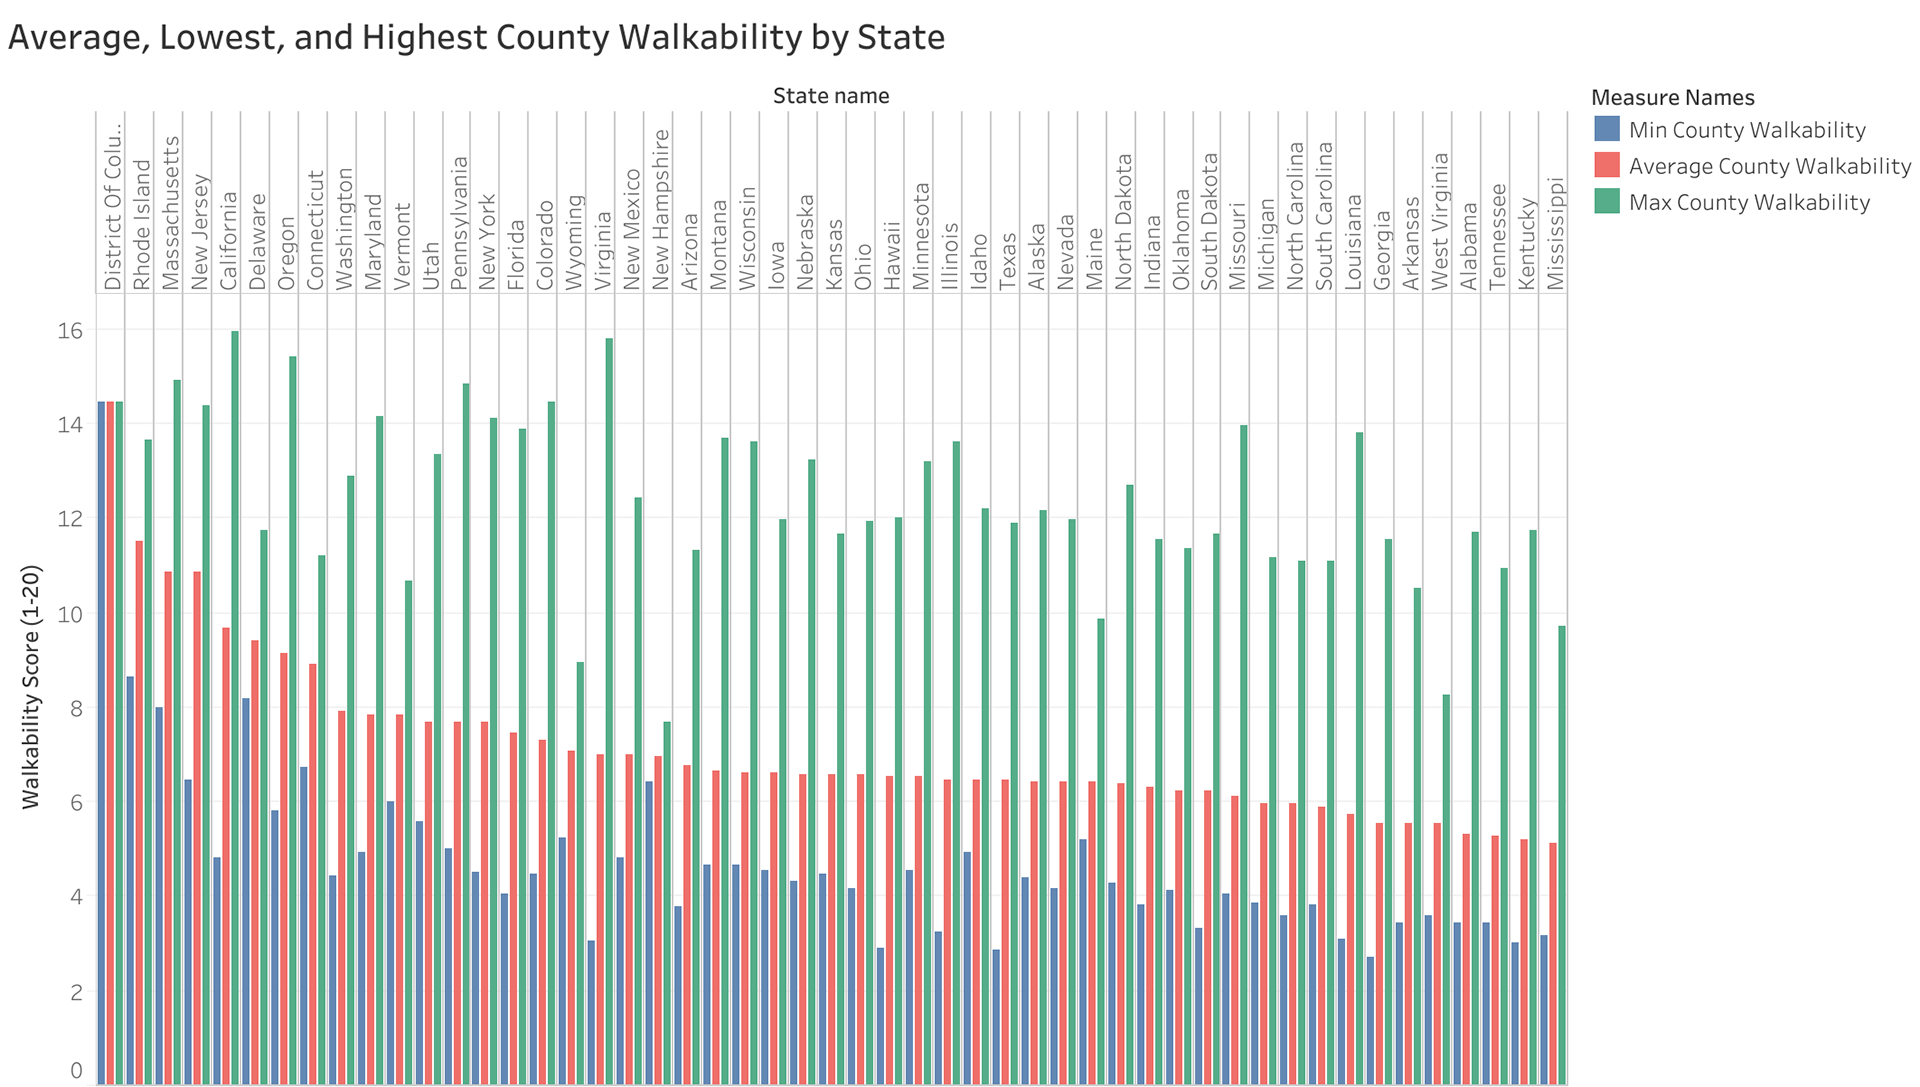
The overall county average walkability by state is 7.15 with a standard deviation of 1.79 (from taking the average of each state's average county walkability. The average of all counties regardless of state is 6.51). If the 1-20 walkability score scale was converted to percentages, the average of 7.15 would only be 35.75%.
The average maximum county walkability per state is 12.4 with a standard deviation of 1.83, and the average minimum is 4.7 with a standard deviation of 1.93.
The highest maximum county walkability is 15.95, and the lowest maximum county walkability is 7.67.
The highest minimum county walkability is 14.47, however this is for Washington, DC which only has one county. The second highest is 8.63. The lowest minimum county walkability is 2.72.
The average range between minimum and maximum county walkability per state is 7.66 with a standard deviation of 2.36.
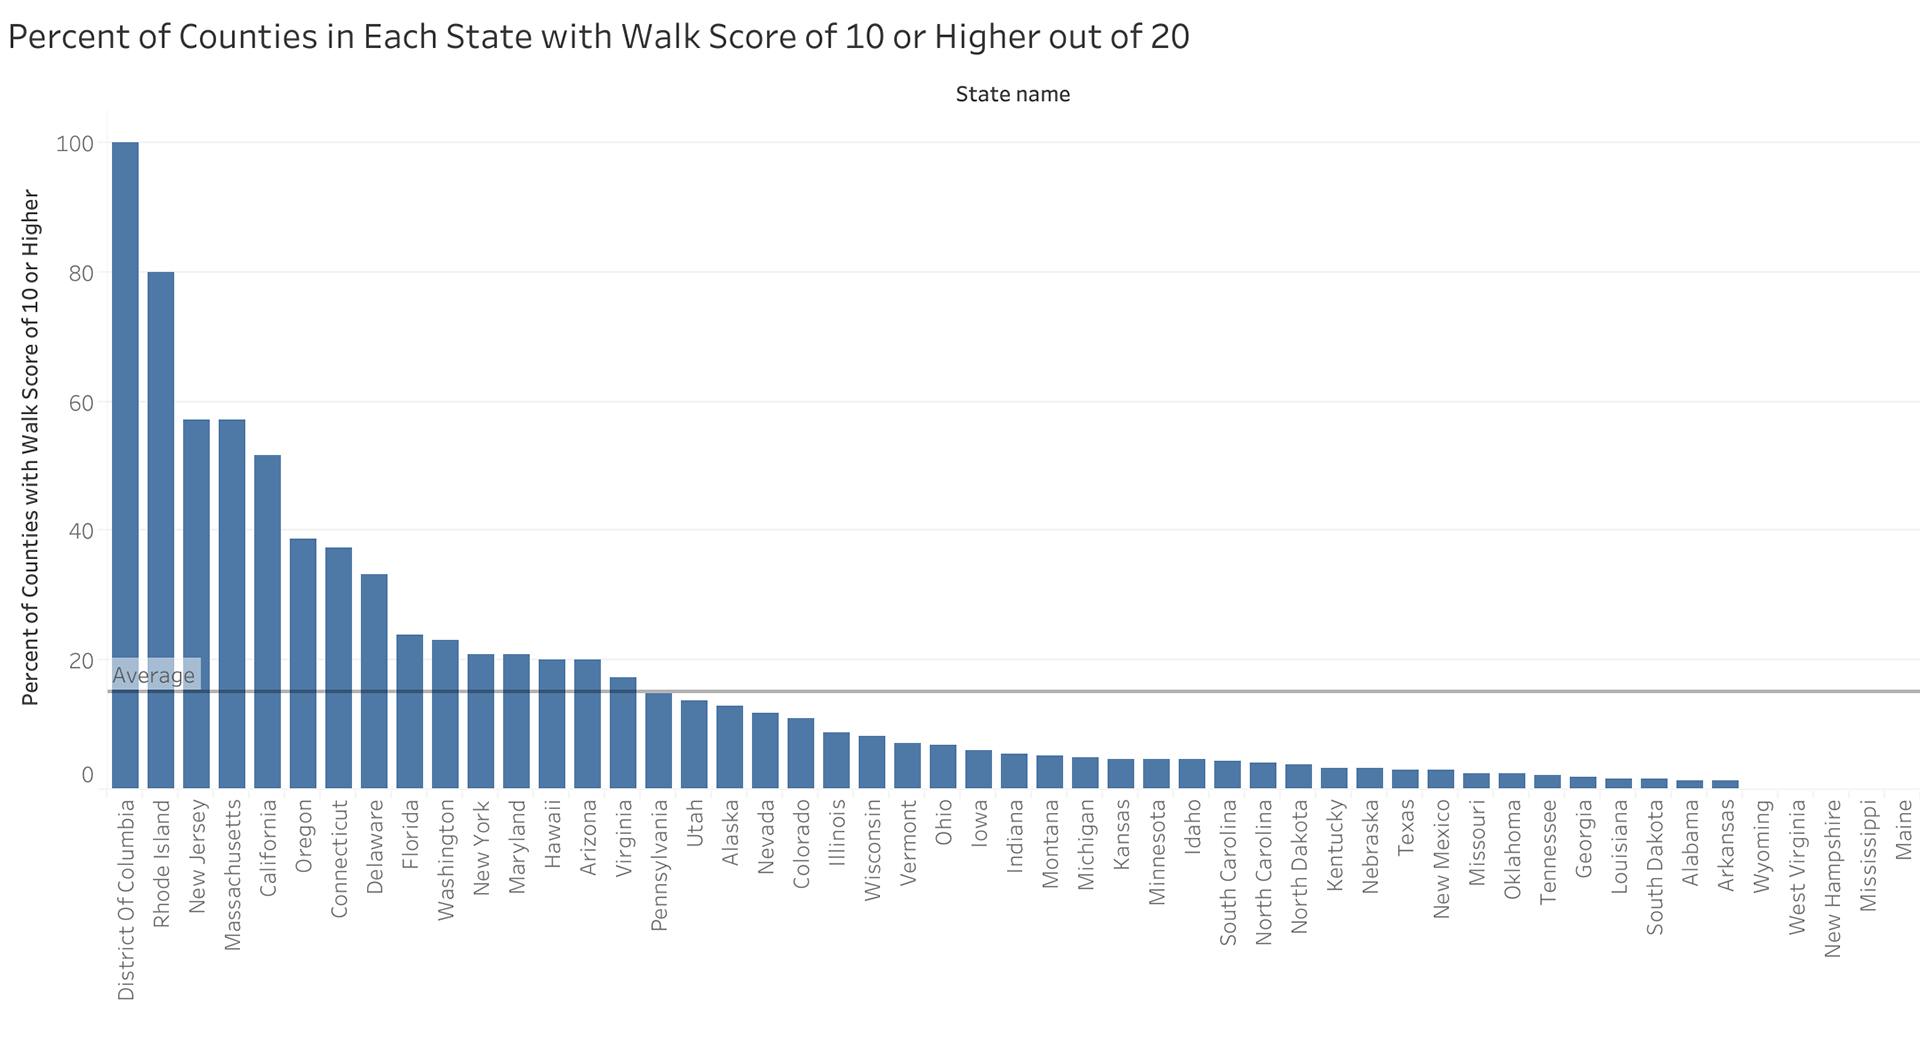
The average percentage of counties in each state with a county walkability score of 10 or higher is only 15.16%. There are only 4 states plus DC where at least 50% of the state (in terms of counties) is at least 50% walkable (meaning the average county walkability is 10 or higher out of 20). 31 states have less than 10% of counties scoring a 10 or above, and 4 states have 0 counties that qualify.
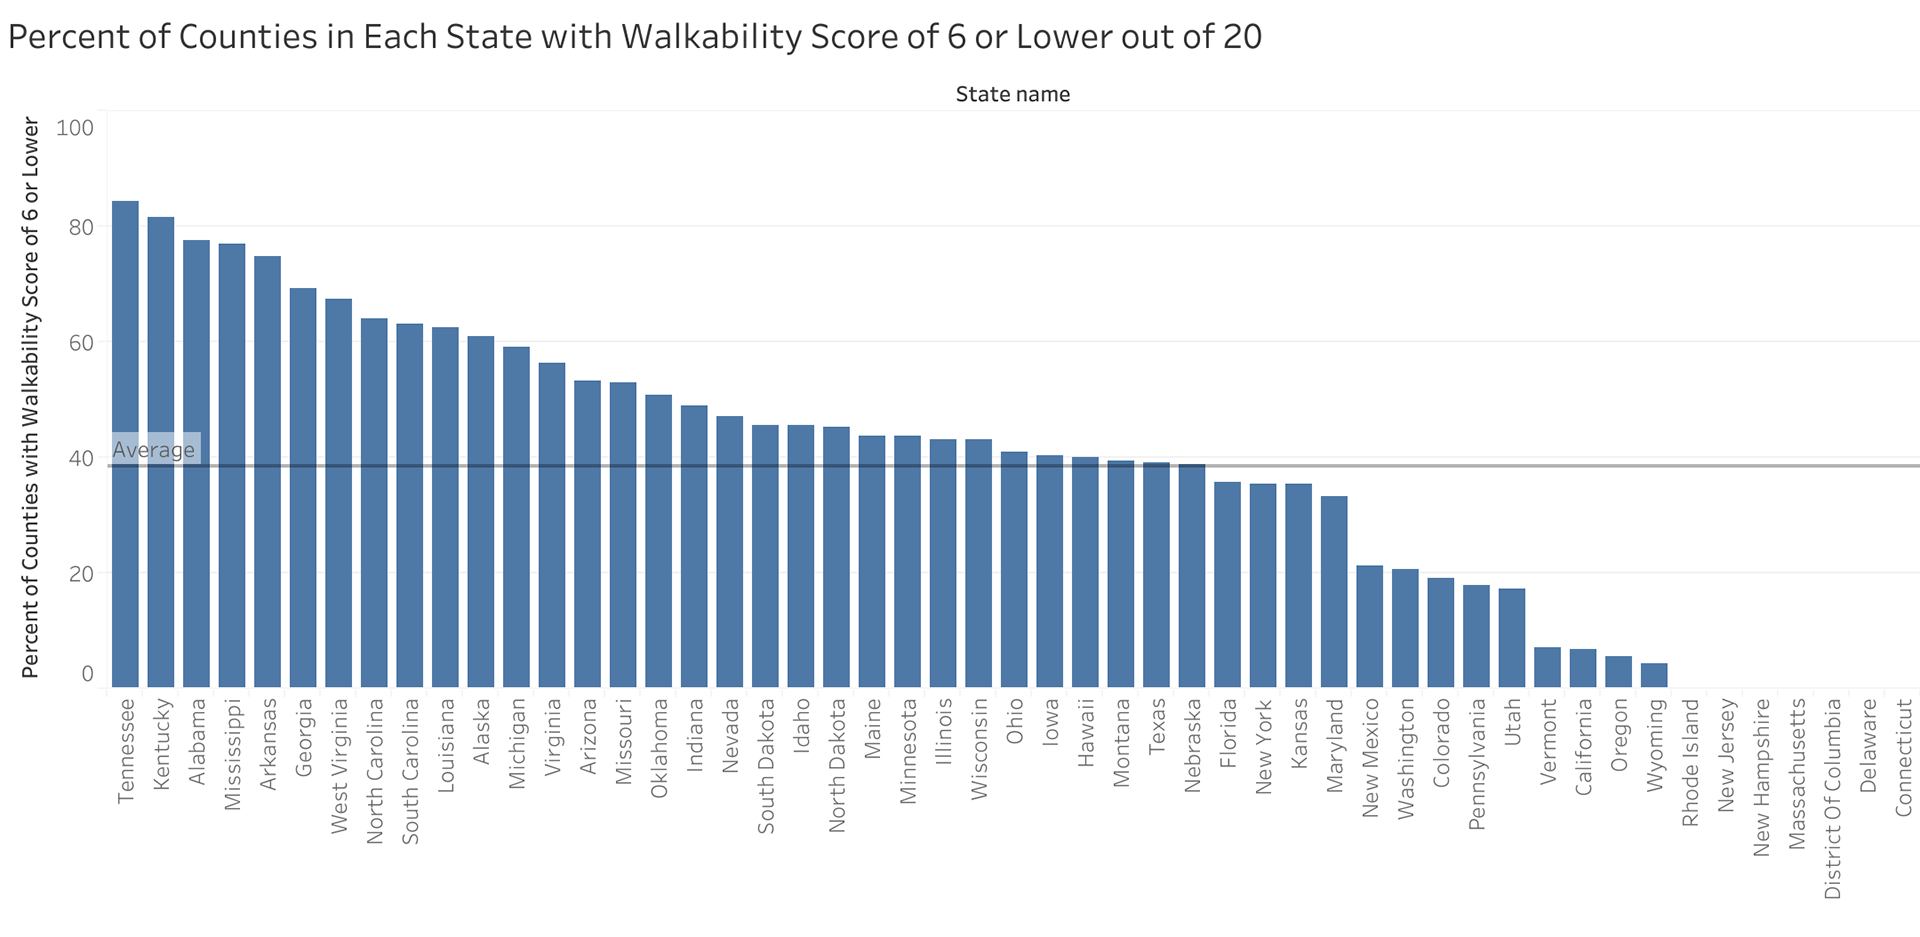
Looking at the lower end of the walkability scale, the average percentage of counties in a state with a walkability score of 6 or lower is 38.39%. There are 16 states where at least half of their counties have an average walkability score of 6 or lower. The bars on this chart are noticeably higher than the chart for percent of counties scoring 10 or higher, which shows that many states tend to have lower levels of walkability. However, 6 states plus DC do not have a single county scoring 6 or lower.
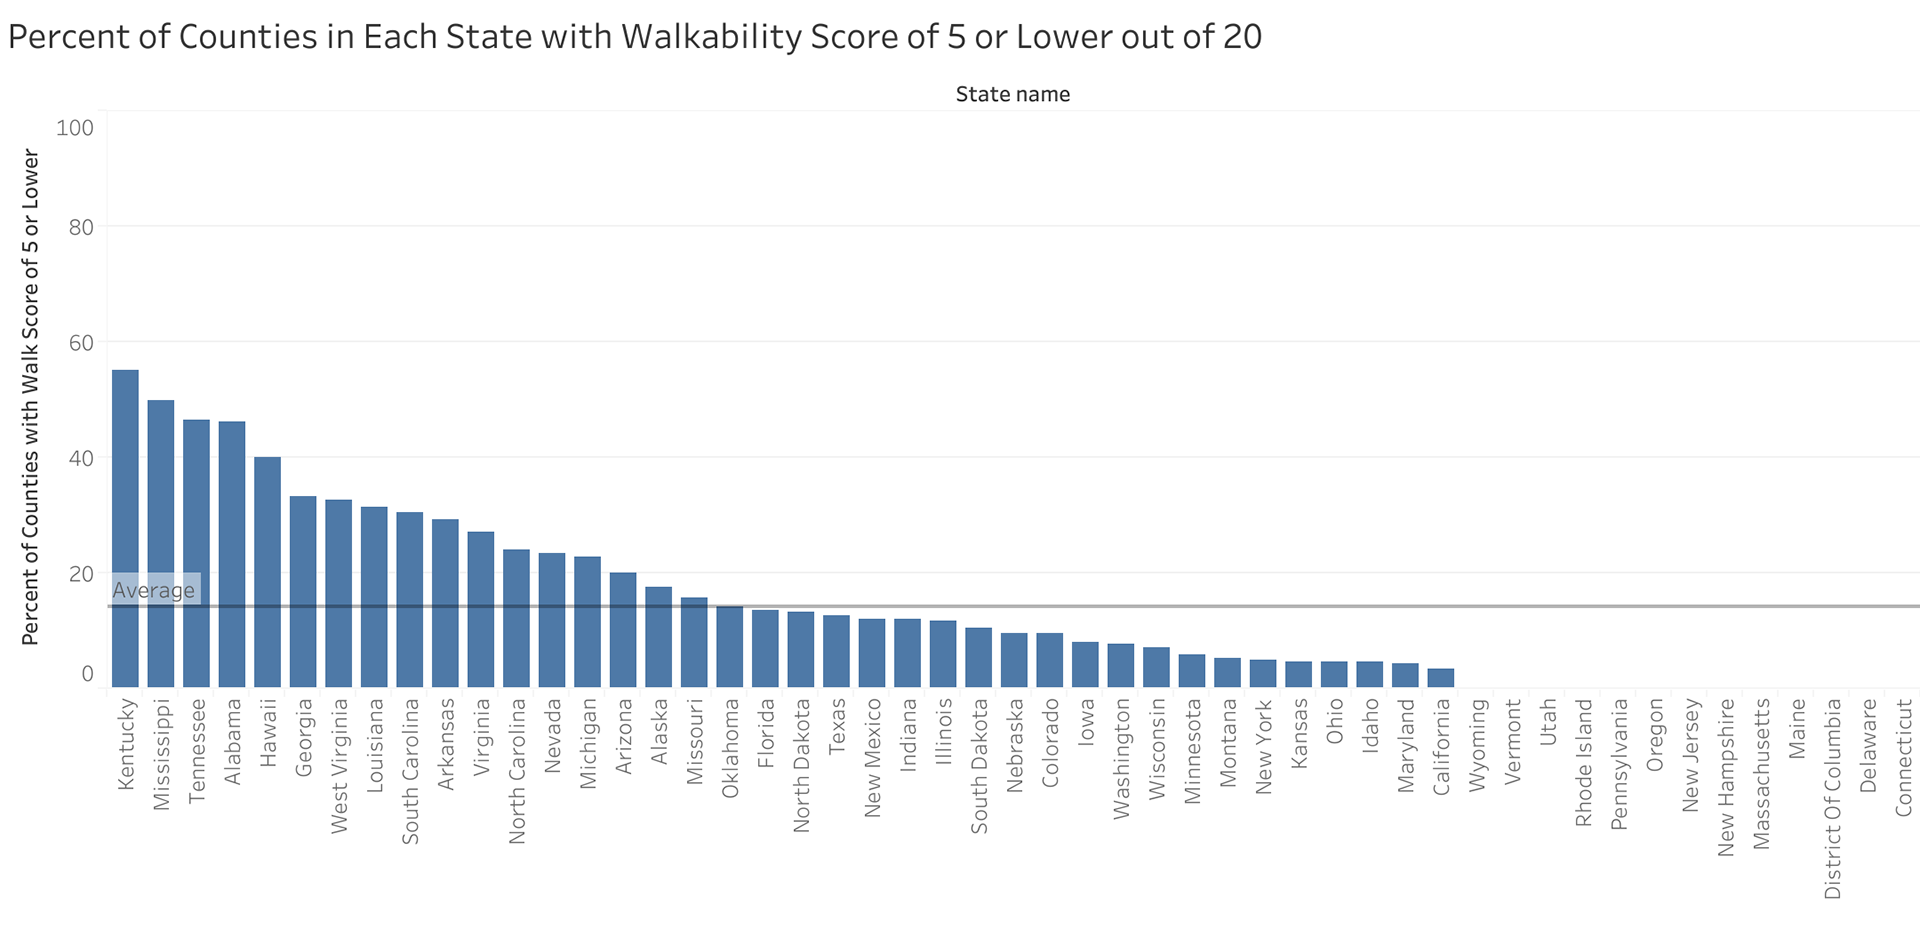
I chose to analyze counties with each state with a walkability score of both 5 and 6 or lower because of how large of a difference there is between the two values. I find it interesting that an average of 14.2% of counties in each state have a walkability score of 5 or lower, while 38.39% score 6 or lower. This is a 24.2% jump from just going up one number on the walkability scale.
There are 5 states where at least 40% of their counties score 5 or lower in walkability. There are only 12 states plus DC that do not have a single county scoring 5 or lower, which could be described as being 25% walkable as the bottom quartile on the walkability scale.
Analyzing how walkability may impact other aspects of life
Correlation between walkability and depression
Part of the reason why I chose to examine walkability was that I heard that people who live in walkable areas tend to be happier, which intrigued me. I wanted to see if the opposite was true - are highly walkable areas associated with lower depression rates?
Cleaning the data
I found a dataset that has prevalence rates for various conditions, including depression. I cleaned the data by removing data for other conditions. I also removed data that was not measured by county. I then formatted the county and state names to match my other dataset by using the TEXTSPLIT function.
Analyzing the data
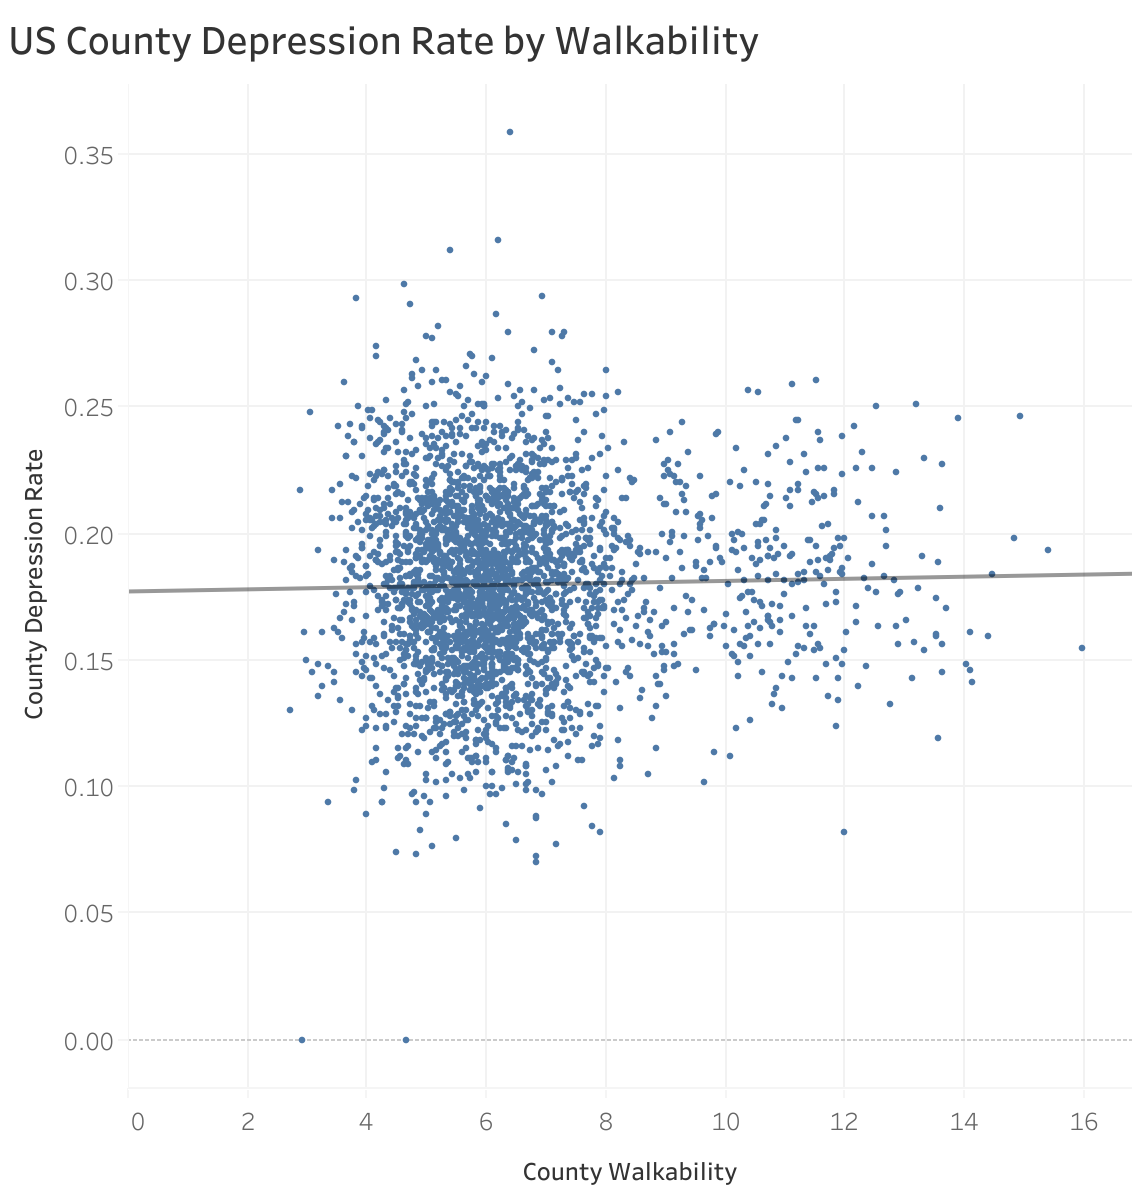
I joined the depression data with the county walkability data so I could find the correlation between county walkability and depression. Using R, I found that the correlation is 0.022 with a p-value of 0.229, which is a very low correlation and not statistically significant. I cannot conclude that walkability has an impact on depression.
Correlation between walkability and obesity
It is easier for people who live in walkable areas to naturally get more exercise throughout the day by walking. I wanted to see how this extra walking may impact people's health, and thought obesity could be a good way to measure this.
Analyzing the data
I found a dataset with obesity and diabetes rates for each county and did minimal cleaning. Using R, I found the correlation between county walkability and obesity to be -0.423 with a p-value of 2.2e-16 meaning that there is a statistically significant correlation between county walkability and obesity.

From this I can conclude that lower walkability is often associated with higher obesity rates. However, there are other factors that could be involved, so I cannot conclude that low walkability directly causes people to become obese, but it might play a role.
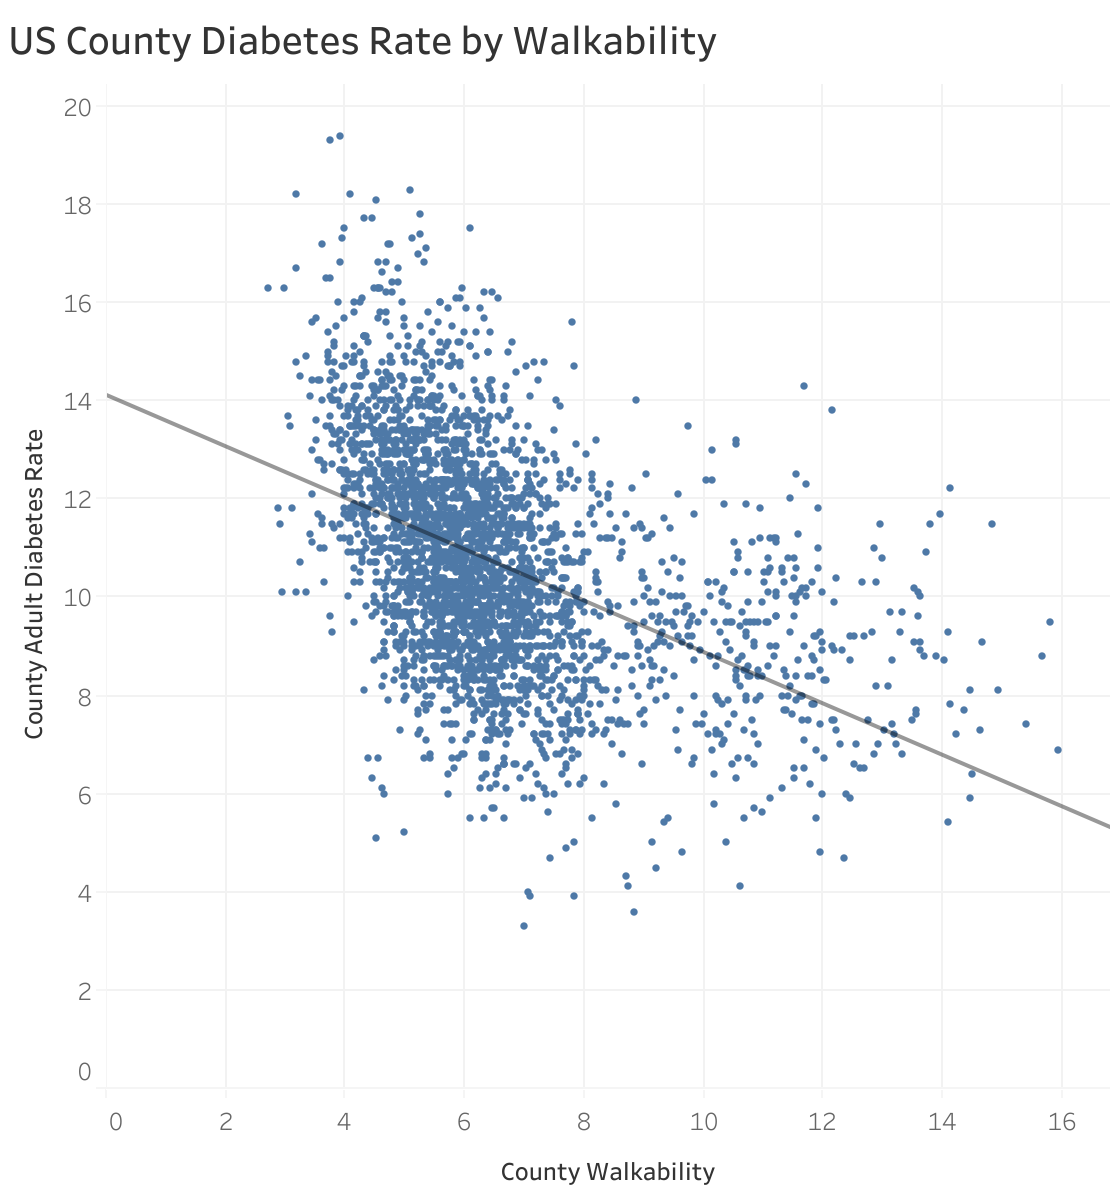
This dataset also had diabetes rate by county, so I decided to assess that as well. The correlation between walkability and diabetes is very similar to obesity and even slightly stronger, with a correlation of -0.463 and p-value of 2.2e-16. This is also statistically significant.
Correlation between walkability and pedestrian accidents
In learning about walkability, I have learned that more walkable areas are safer for pedestrians because of the way they are designed. I thought pedestrian accident rates could help assess the safety of each county in terms of walkability. I thought less walkable areas might have more pedestrian accidents due to unsafe walking conditions, but could also see these areas having fewer pedestrians due to low walkability therefore reducing the chances of accidents occurring. Pedestrian accidents alone cannot represent a county's safety, but could still serve as an indicator.
Cleaning the data
The data set I used contained data on many different types of traffic-related accidents for the year of 2020. I removed all data that did not involve pedestrians. The data had separate rows for the vehicle occupants and pedestrians involved in each accident, so I removed rows for drivers and passengers so that each row would be a unique event. There were many columns I did not need, so I removed those as well.
State and county codes were provided, and I created a column combining the codes to identify each unique county.
Analyzing the data
I created a separate sheet in the Excel file where I found the total number of pedestrian accidents for each county. I joined this table with the walkability data and population data in SQL and found the accident rate for each county based on population. I found the correlation between county walkability and pedestrian accident rate to be -0.227 with a p-value of 1.27. This means there is a slight correlation where accidents decrease with higher walkability, but is not statistically significant. It isn't proven that less walkable areas result in more pedestrian accidents, but it also does not mean they are safe to walk in.

Final thoughts
Through conducting this analysis, it is clear that much of the United States has low walkability. The areas with major cities tend to have higher walkability, but there are also many cities that are not as high in walkability as one might think a city would be. With 57.8% of the US population living in a place with a walkability score of 10 or lower out of 20 and and 16.45% in a place with a score of 5 or lower, some improvements could definitely be made.
Much of the country is made up of suburbs and small towns, which are designed in a way that prioritizes cars and can be dangerous for pedestrians. Although the correlation between walkability and pedestrian accidents did not show up as significant, I would like to do more analysis to assess this, such as analyzing infrastructure. Regardless of safety, this distance between locations makes it difficult to walk places.
People living in areas with higher walkability have greater ease of getting places, especially considering the cost of cars and requirement of being physically and mentally able to drive. Space is used more efficiently, and there are more stores, restaurants, parks, and services within a closer proximity. Another common argument in support of greater walkability is that it helps foster community.
From this analysis I can tell that walkability could have an impact on health (in terms of obesity and diabetes). I was able to get insights on how walkability levels are spread across the country, and how the population is distributed in terms of walkability. The results of this analysis can be used to determine which places need the most improvement, and which areas to look at as good examples of high walkability. It can also serve as evidence to point out how much of the country has low walkability. From what I've learned, walkable communities can have great benefits on people and I would love to do more research/analysis on the benefits of walkable communities.